Writing better R functions part two – April 10, 2018
Tagged as: [In my last post I started
to build two functions that took pairs of variables from a dataset and
produced some nice useful ggplot plots from them. We started with the
simplest case, plotting counts of how two variables cross-tabulate. Then
we worked our way up to being able to automate the process of plotting
lots of pairings of variables from the same dataframe. Today we’ll
improve our functions and add a feature. For now, we’re going to
continue to make use of the built in dataframe known as mtcars. We’re
doing that to make sure that whatever we do in this post today, it works
on a known start point so we can compare and contrast.
I’m going to output all the plots in a smaller size for the benefit of you the readers. I’m doing that via RMarkdown and it won’t happen automatically for you if you download and use the code. I’ll be using , fig.width=4.5, fig.height=2
Background and catch-up
Some quick setup.
library(dplyr)
library(ggplot2)
theme_set(theme_bw()) # set theme to my personal preference
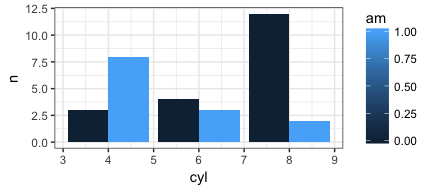
We started with a simple task in the console. Take two of the mtcars
variables, in this case am and cyl, and conduct a cross tabulation
and then plot it.
### with dplyr and ggplot manually
mtcars %>%
  filter(!is.na(am), !is.na(cyl))  %>%
  group_by(am,cyl) %>%
  count() %>%
  ggplot(aes(fill=am, y=n, x=cyl)) +
    geom_bar(position="dodge", stat="identity")
By the end of the last post we had accomplished the following tasks:
- Our function (called
PlotMe) was a lot more robust. It checked for basic user entry errors, added a useful title and generally did what we wanted. - Along the way we learned the “tricks” of working with
dplyrandggplot2inside of functions.
Here’s the PlotMe function as we left it.
PlotMe <- function(dataframe,x,y){
# error checking
  if (!require(ggplot2)) {
    stop("Can't continue can't load ggplot2")
  }
  theme_set(theme_bw())
  if (!require(dplyr)) {
    stop("Can't continue can't load dplyr")
  }
  dfname <- deparse(substitute(dataframe))
  aaa <- enquo(x)
  bbb <- enquo(y)
  if (length(match.call()) <= 3) {
    stop("Not enough arguments passed... requires a dataframe, plus two variables")
  }
  if (!exists(deparse(substitute(dataframe)))) {
     stop("The first item in your list does not exist")
  }
  if (!is(dataframe, "data.frame")) {
    stop("The first name you passed does not appear to be a data frame")
  }
  if (!deparse(substitute(x)) %in% names(dataframe)) {
    stop(paste0("'", deparse(substitute(x)), "' is not the name of a variable in '",deparse(substitute(dataframe)),"'"))
  }
  if (!deparse(substitute(y)) %in% names(dataframe)) {
    stop(paste0("'", deparse(substitute(y)), "' is not the name of a variable in '",deparse(substitute(dataframe)),"'"), call. = FALSE)
  }
  missing <- apply(is.na(dataframe[,c(deparse(substitute(x)),deparse(substitute(y)))]), 1, any)
  if (any(missing)) {
    warning(paste(sum(missing)), " row(s) not plotted because of missing data")
  }
# end of error checking
  dataframe %>%
    filter(!is.na(!! aaa), !is.na(!! bbb))  %>%
    mutate(!!quo_name(aaa) := factor(!!aaa), !!quo_name(bbb) := factor(!!bbb)) %>%
    group_by(!! aaa,!! bbb) %>%
    count() %>%
    ggplot(aes_(fill=aaa, y=~n, x=bbb)) +
      geom_bar(position="dodge", stat="identity") +
      ggtitle(bquote("Crosstabs"*.(dfname)*.(aaa)~"by"*.(bbb))) +
      ylab("Count") ->p
  plot(p)
}
PlotMe(mtcars,am,cyl)

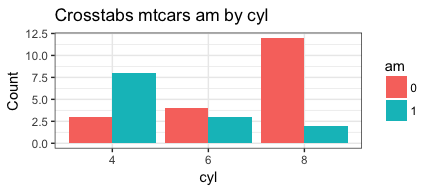
Making our function better
Our next step is to allow the user to choose which of three plot types
they’d like. We have been focusing on simple side by side grouped bars
that are obtained with geom_bar(position="dodge", stat="identity")
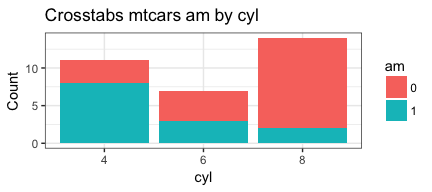
But we can also “stack” the bars with by changing to
geom_bar(stat="identity")
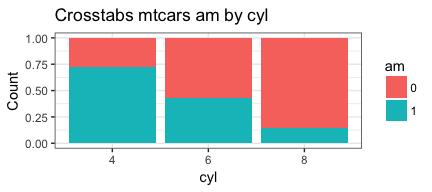
Or focus on percentages of the category totals with
geom_bar(stat="identity", position="fill")…
The key is that our entire function is the same, except for one part of
one line in the function the geom_bar(). The last thing we want to do
is write three different functions, or replicate too much code within
one function. Let’s say, for the sake of argument, we’d like to simply
have the user specify whether they want type “side”, “stack” or
“percent”. (We could choose any names we like but these will do for
now). Let’s say, that we’d like to call this variable within our
function plottype. We’d make side the default, but allow the user to
override that and choose either stack or percent instead. So, at the
beginning of the function we’ll add…
PlotMeX <- function(dataframe, x, y, plottype = "side"){
Depending on their choice we’ll set the geom_bar() details. So it’s a
kind of a switch hint, hint. Inside of the switch we’ll use the
fact that we can pass ggplot list items. Each choice "side",
“stack”, or “percent” causes us to set two things:
- the parameters to
geom_barand, - the Y axis label
ylab(since in two cases it’s a count and in one it’s a percent).
PlotMeX <- function(dataframe, x, y, plottype = "side"){
  switch(plottype,
       side =  list(geom_bar(position="dodge", stat="identity"),
                    ylab("Count")) -> whichbar,
       stack = list(geom_bar(stat="identity"),
                    ylab("Count")) -> whichbar,
       percent = list(geom_bar(stat="identity", position="fill"),
                    ylab("Percent")) -> whichbar
    )
Notice that based upon the value going into the switch we are
assigning the proper information to an object called whichbar. Later
in our function we’ll insert that into our ggplot flow…
    ggplot(aes_(fill=aaa, y=~n, x=bbb)) +
      whichbar +
      ggtitle(bquote("Crosstabs"~.(dfname)*.(aaa)~"by"*.(bbb))) ->p
Here’s our new version of the function. Temporarily named PlotMeX, and
with the error checking removed just for brevity, but it’s what we want.
Let’s test it against am by vs just for a variable change of pace.
PlotMeX <- function(dataframe, x, y, plottype = "side"){
switch(plottype,
side = list(geom_bar(position="dodge", stat="identity"),
ylab("Count")) -> whichbar,
stack = list(geom_bar(stat="identity"),
ylab("Count")) -> whichbar,
percent = list(geom_bar(stat="identity", position="fill"),
ylab("Percent")) -> whichbar
)
aaa <- enquo(x)
bbb <- enquo(y)
dfname <- deparse(substitute(dataframe))
dataframe %>%
filter(!is.na(!! aaa), !is.na(!! bbb)) %>%
mutate(!!quo_name(aaa) := factor(!!aaa), !!quo_name(bbb) := factor(!!bbb)) %>%
group_by(!! aaa,!! bbb) %>%
count() %>%
ggplot(aes_(fill=aaa, y=~n, x=bbb)) +
whichbar +
ggtitle(bquote("Crosstabs"*.(dfname)*.(aaa)~"by"*.(bbb))) ->p
plot(p)
}
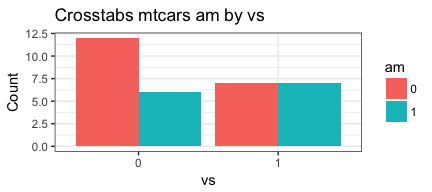
PlotMeX(mtcars,am,vs)
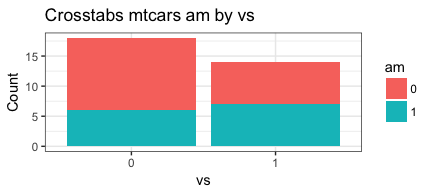
PlotMeX(mtcars,am,vs, "stack")
PlotMeX(mtcars,am,vs, "percent")
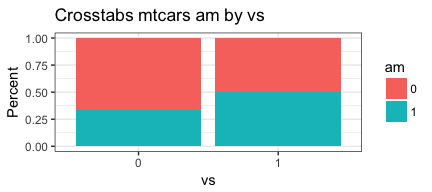
Looks good!
Automating even more
A few posts back we also recognized that if we need to work on multiple
pairs of variables in the same dataframe (not uncommon in my field). It
would be very tedious to keep running the PlotMeX function over and
over again. So we developed a block of code that does something
important for us. We feed it the column numbers of the variables we
want to pair, accounting for which side of the plot (dependent or
independent) we want them on, and the code produces two lists that we
can systematically feed to our PlotMeX function and produce lots of
plots.
There are any number of ways we could pass the columns, by quoted name,
by bare name or as I have done with simple column numbers. I honestly
prefer just looking up the numbers or a range of numbers. Far less
typing for me and the ability to incorporate lots of variables with the
colon : shortcut, e.g. 3:333.
So the process would be to choose some variables for one side of the
by, in this case let’s say gear and carb those are columns 10 & 11
so we can write c(10:11) on the other side cyl & am written as
c(2,9).
# Build two vectors
xwhich <- c(10:11) # let's put gear and carb in here
ywhich <- c(2,9) # let's put cyl and am in here
Then we create two empty lists that we will insert the variable names
into and a counter variable (not strictly necessary but I’ll actually
use it in a minute). We could of course rewrite our function to accept
column numbers instead of variable names right from the outset. But I’m
choosey. When I work in small batches I want to be able to use names,
it’s only when I have a lot of names I prefer to operate by number. It
is essential to initialize the lists, and if I were ever to intend to
have large lists it would be preferable to specifiy a length in advance
for performance reasons. Something like indvars <- vector("list",
length(xwhich)*length(ywhich)) but for now I’m going to keep it simple.
indvars<-list() # create empty list to add to
depvars<-list() # create empty list to add to
totalcombos <- 1 # keep track of where we are
Now we take xwhich and ywhich and run them through some nested loops
and see if we get the four possible pairings we are expecting.
# loop through the vectors and build our lists
for (j in seq_along(xwhich)) {
  for (k in seq_along(ywhich)) {
    depvars[[totalcombos]] <- as.name(colnames(mtcars[xwhich[[j]]]))
    indvars[[totalcombos]] <- as.name(colnames(mtcars[ywhich[[k]]]))
    cat("iteration #", totalcombos,
        " xwhich is ", xwhich[[j]], " so depvars = ", as.name(colnames(mtcars[xwhich[[j]]])),
        " ywhich is ", ywhich[[k]], " so indvars = ", as.name(colnames(mtcars[ywhich[[k]]])),
        "\n", sep = "")
    totalcombos <- totalcombos +1
  }
}
## iteration #1 xwhich is 10 so depvars = gear ywhich is 2 so indvars = cyl
## iteration #2 xwhich is 10 so depvars = gear ywhich is 9 so indvars = am
## iteration #3 xwhich is 11 so depvars = carb ywhich is 2 so indvars = cyl
## iteration #4 xwhich is 11 so depvars = carb ywhich is 9 so indvars = am
Yes that looks like what we want. It’s a bit trivial for 4 plots but
imagine the effort savings if you had 5 variables on each side. Keeping
track of 25 possibilities by hand is annoying. So the simplest case of
our function is PlotMeX(mtcars, am, cyl). We’ll feed our function and
our two lists to mapply and let it do the tedious work for us.
N.B. If you don’t wrap it with invisible mapply will actually
return two copes of the plots. More on that in a bit.
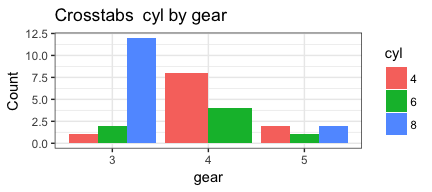
#PlotMeX(mtcars,am,cyl)
invisible(mapply(PlotMeX, x=indvars, y=depvars, MoreArgs = list(dataframe=mtcars), SIMPLIFY = FALSE, USE.NAMES = FALSE))
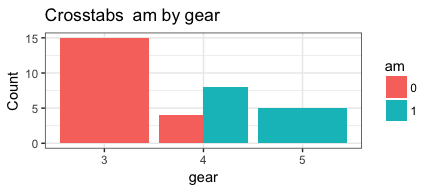
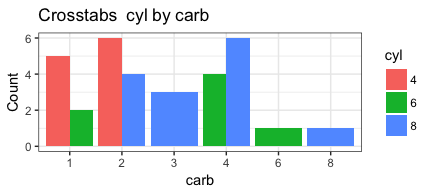
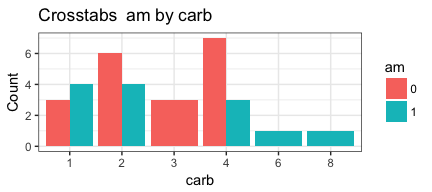
Notice that MoreArgs is a list. We are passing it the name of the
mtcars dataset but we can also pass it other parameters such as our
plottype
preference.
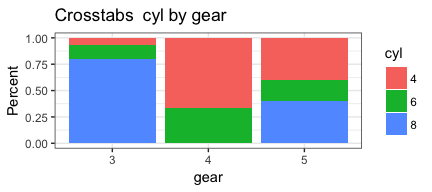
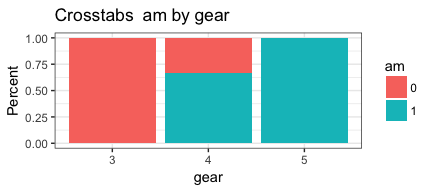
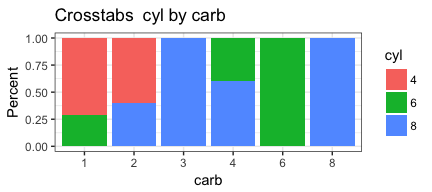
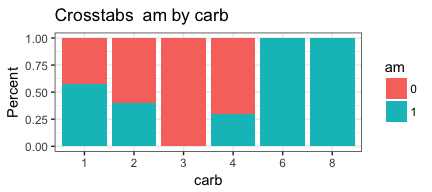
invisible(mapply(PlotMeX, x=indvars, y=depvars, MoreArgs = list(dataframe=mtcars, plottype = "percent"), SIMPLIFY = FALSE, USE.NAMES = FALSE))
Now we can turn this working code into a function so we can reuse it. To
do that we’ll have the user specify the dataframe, xwhich and
ywhich as parameters to the function. Then inside the function we’ll
do the work and return the user the two lists that can be used to “feed”
mapply. I’m personally a fan of providing some feedback in the console
to inform the user of what’s going on, even though the actual output
product of the function is just a list with two sublists nested inside.
On the other hand we’ll return the list “invisibly” since we don’t
really need to print out the list structure.
CrossXYs <- function(dataframe, xwhich, ywhich){
  # Build two vectors
indvars<-list() # create empty list to add to
depvars<-list() # create empty list to add to
totalcombos <- 1 # keep track of where we are
message("Creating the variable pairings...")
for (j in seq_along(xwhich)) {
  for (k in seq_along(ywhich)) {
    depvars[[totalcombos]] <- as.name(colnames(dataframe[xwhich[[j]]]))
    indvars[[totalcombos]] <- as.name(colnames(dataframe[ywhich[[k]]]))
    cat("Pairing #", totalcombos, " ", as.name(colnames(dataframe[xwhich[[j]]])),
        " with ", as.name(colnames(dataframe[ywhich[[k]]])), "\n", sep = "")
    totalcombos <- totalcombos +1
  }
}
return(invisible(list(depvars=depvars,indvars=indvars)))
}
CrossXYs(mtcars,c(10:11),c(2,9))
## Creating the variable pairings...

## Pairing #1 gear with cyl
## Pairing #2 gear with am
## Pairing #3 carb with cyl
## Pairing #4 carb with am
This code produces the two lists with the column names varying in the
way we want them. So the next step it to put them somewhere (we’ll call
that bothlists)
bothlists <- CrossXYs(mtcars,c(10:11),c(2,9))
## Creating the variable pairings...

## Pairing #1 gear with cyl
## Pairing #2 gear with am
## Pairing #3 carb with cyl
## Pairing #4 carb with am
Then we can use them as part of our mapply call by addressing them as
bothlists$indvars & bothlists$depvars, otherwise our command remains
the
same.
invisible(mapply(PlotMeX, x=bothlists$indvars, y=bothlists$depvars, MoreArgs = list(dataframe=mtcars, plottype = "stack"), SIMPLIFY = FALSE, USE.NAMES = FALSE))
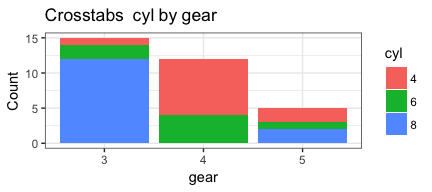
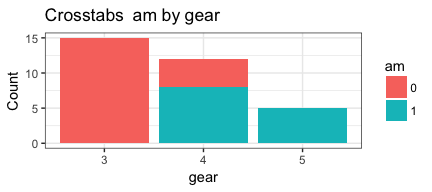
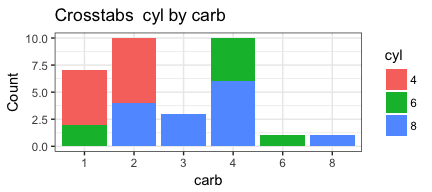
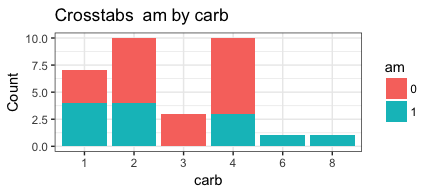
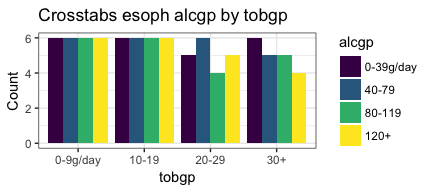
Appears to be working as we want it to. Which means it’s a good time to
test it on some other data and see if anything breaks. Let’s try the
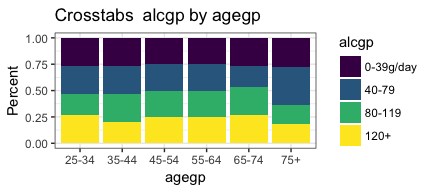
esoph dataset… First we’ll call PlotMeX with alcgp by tobgp. Then
we’ll make CrossXYs give us lists for agegp by alcgp & tobgp.
That should reassure us that all is well.
str(esoph)
## 'data.frame':    88 obs. of  5 variables:
##  $ agegp    : Ord.factor w/ 6 levels "25-34"<"35-44"<..: 1 1 1 1 1 1 1 1 1 1 ...
##  $ alcgp    : Ord.factor w/ 4 levels "0-39g/day"<"40-79"<..: 1 1 1 1 2 2 2 2 3 3 ...
##  $ tobgp    : Ord.factor w/ 4 levels "0-9g/day"<"10-19"<..: 1 2 3 4 1 2 3 4 1 2 ...
##  $ ncases   : num  0 0 0 0 0 0 0 0 0 0 ...
##  $ ncontrols: num  40 10 6 5 27 7 4 7 2 1 ...
PlotMeX(esoph,alcgp,tobgp)
bothlists <- CrossXYs(esoph,1,c(2:3))
## Creating the variable pairings...

## Pairing #1 agegp with alcgp
## Pairing #2 agegp with tobgp
invisible(mapply(PlotMeX, x=bothlists$indvars, y=bothlists$depvars, MoreArgs = list(dataframe=esoph, plottype = "percent"), SIMPLIFY = FALSE, USE.NAMES = FALSE))
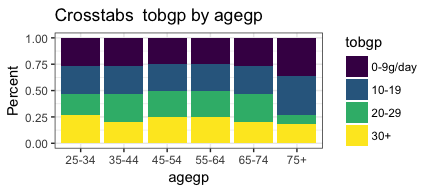
Very nice! We seem to have accomplished what we set out to do.
All done (not yet!)
This has become a very long post so I’m going to end here. But the astute among you have probably detected we’re still being inefficient. Be nice if we could integrate these two functions a little better so we didn’t have to think of it as a two step process. Great idea for a next post on a future day.
I hope you’ve found this useful. I am always open to comments, corrections and suggestions.
Chuck (ibecav at gmail dot com)
License

This
work is licensed under a
Creative
Commons Attribution-ShareAlike 4.0 International License.