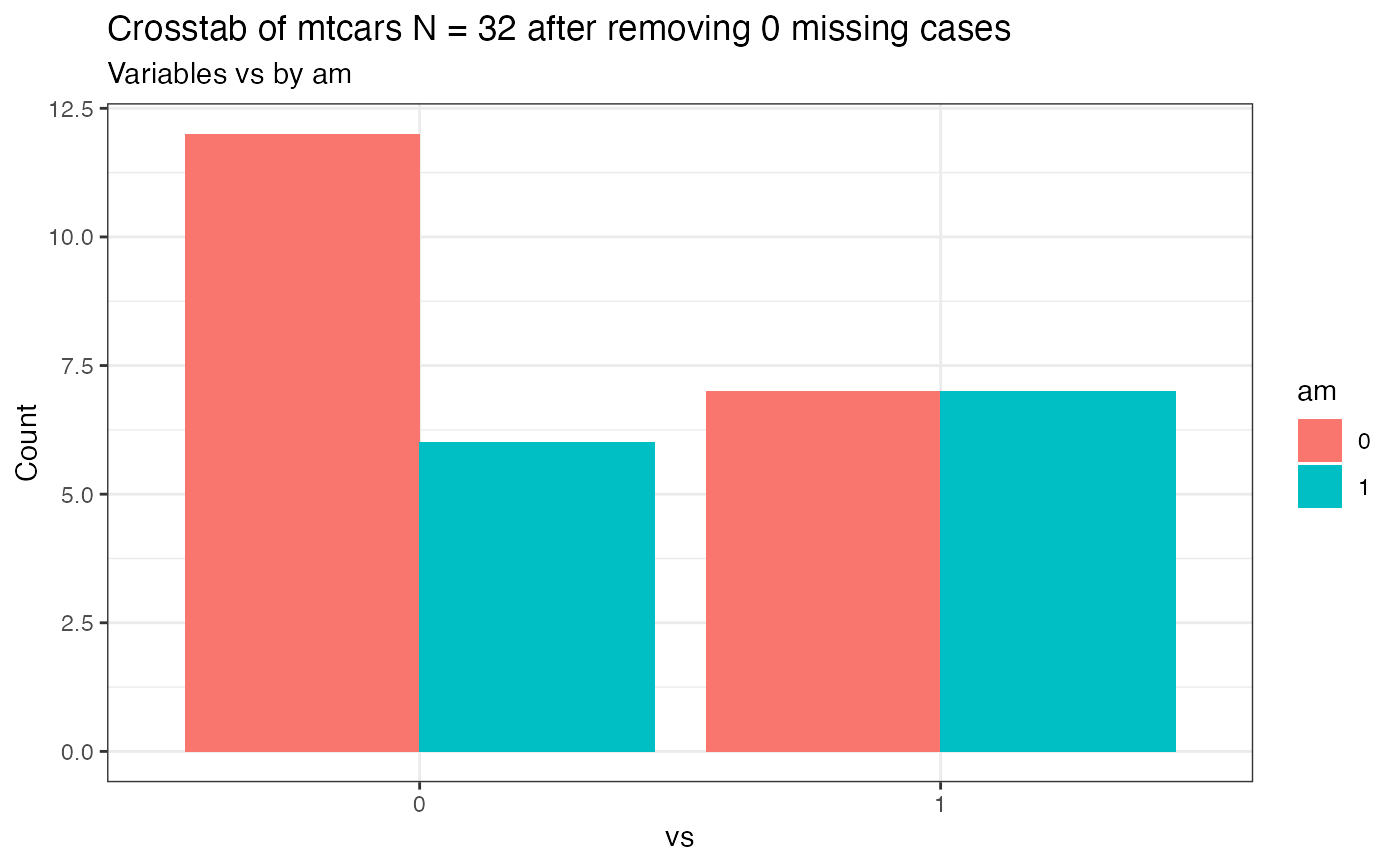
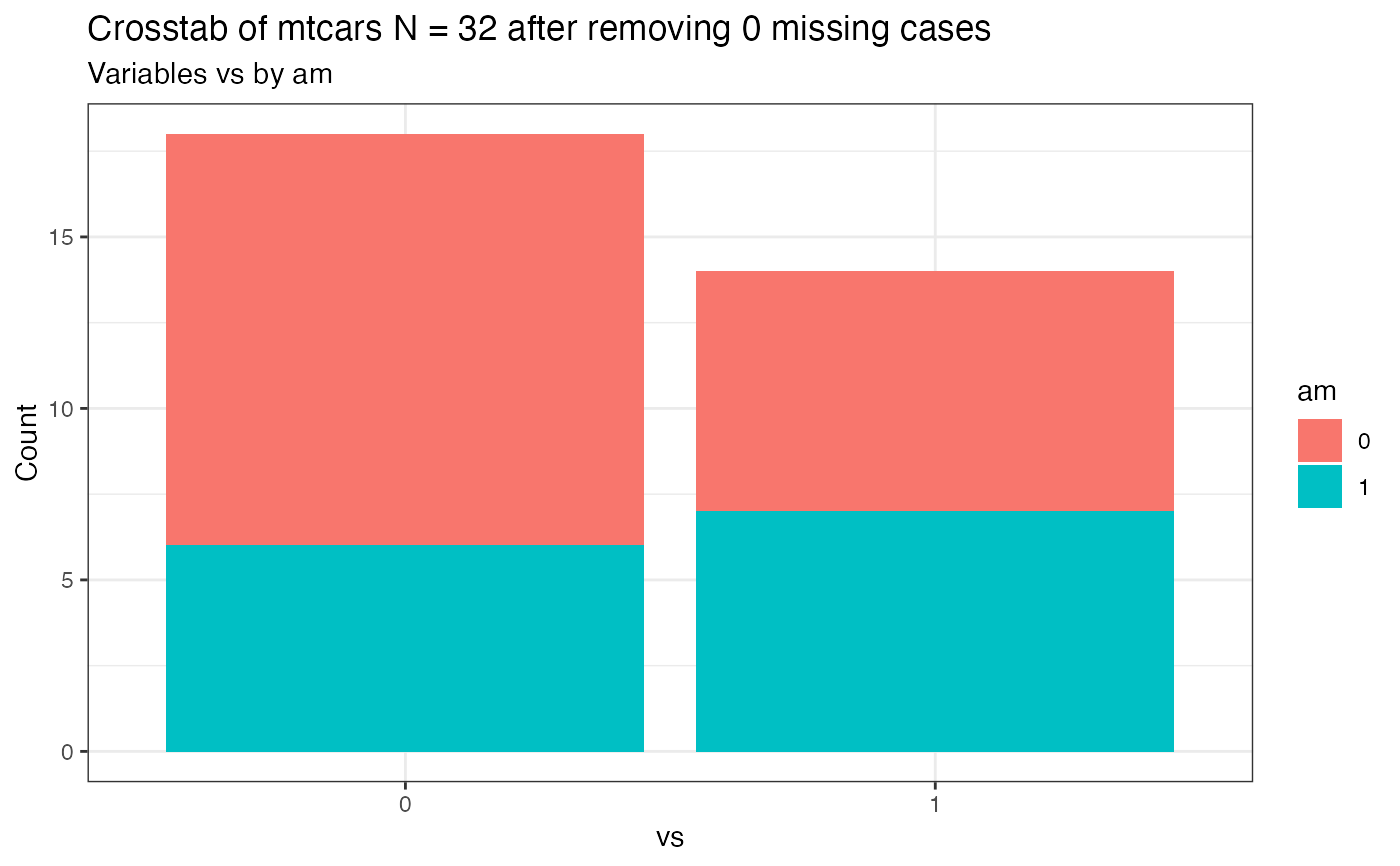
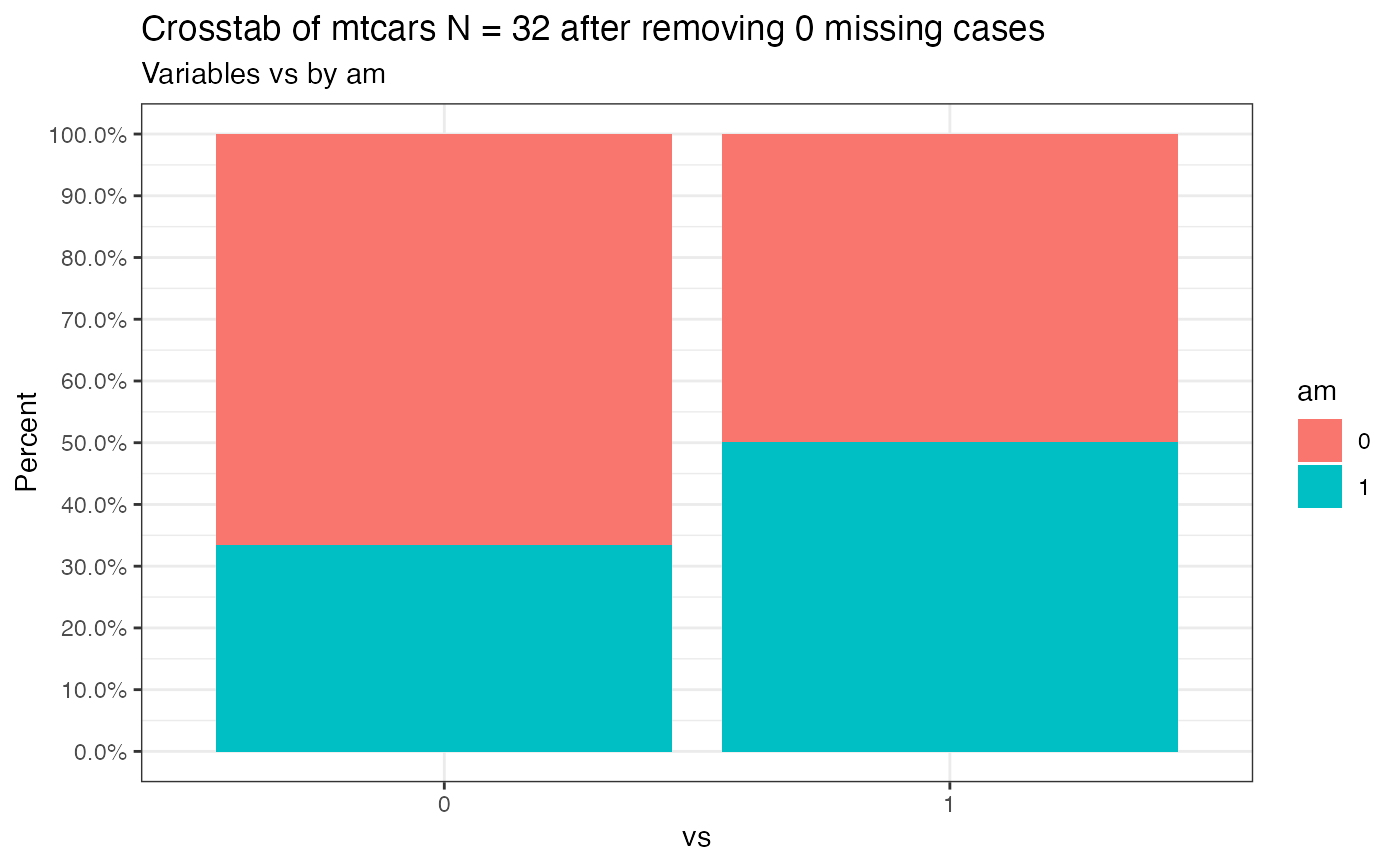
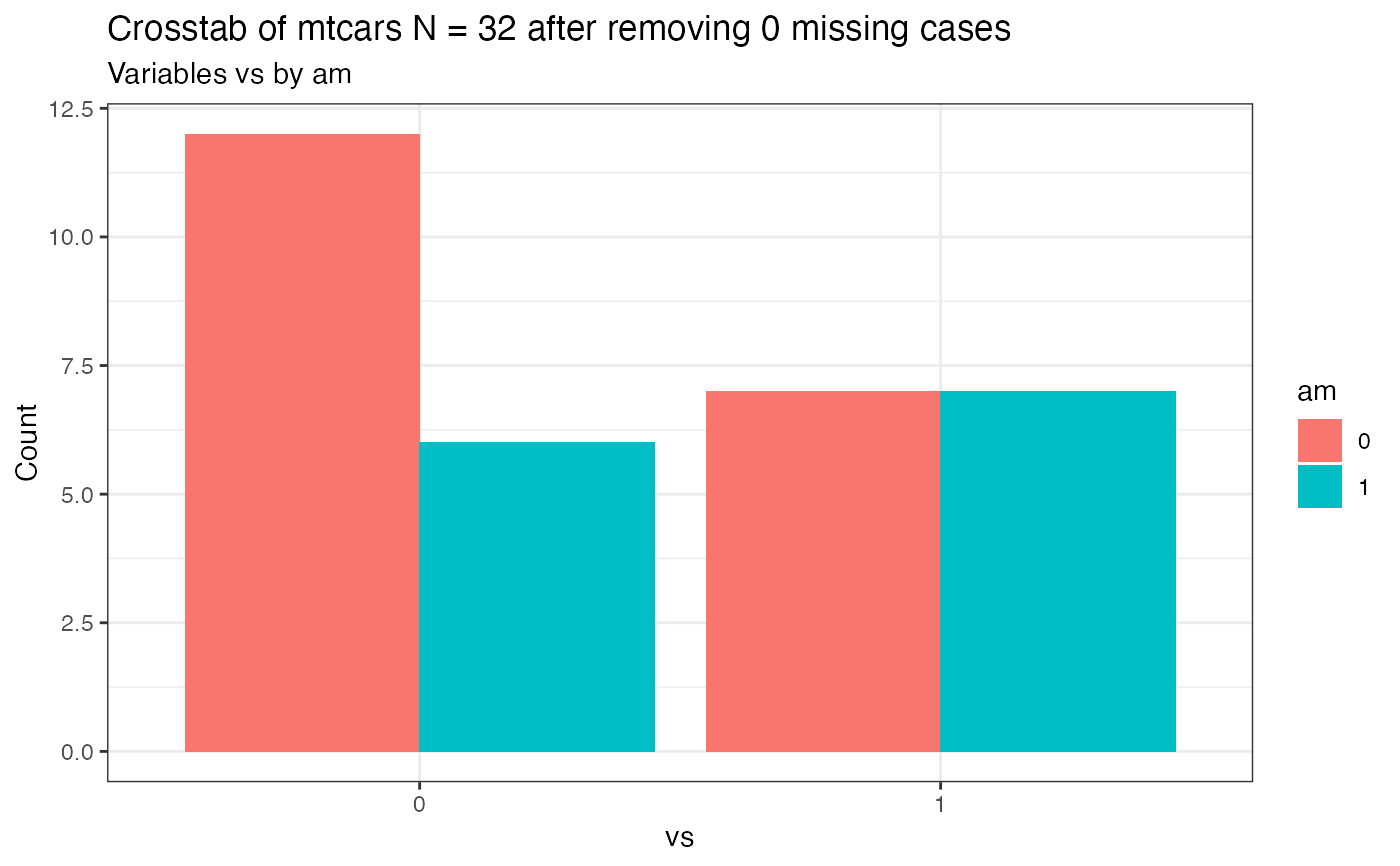
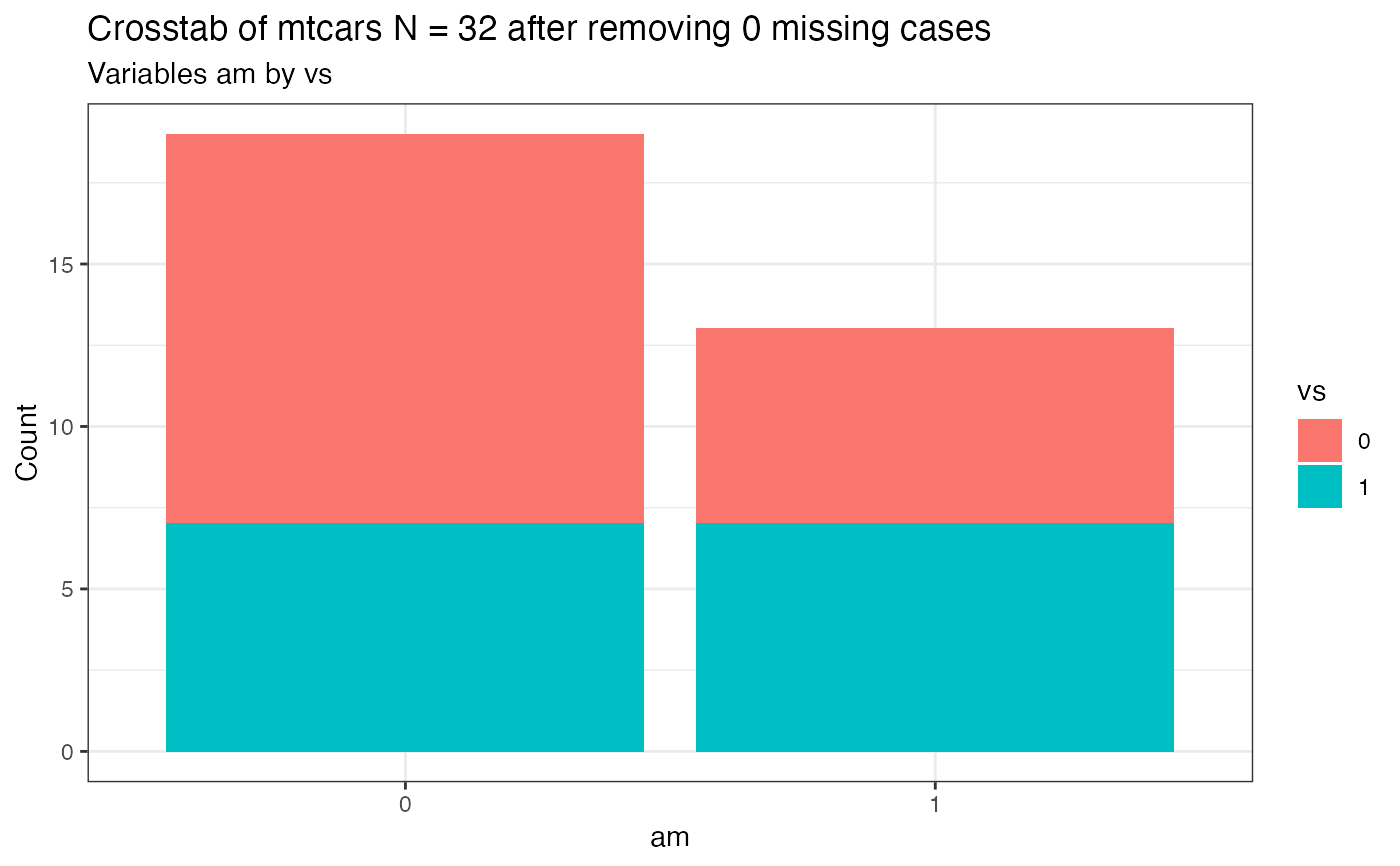
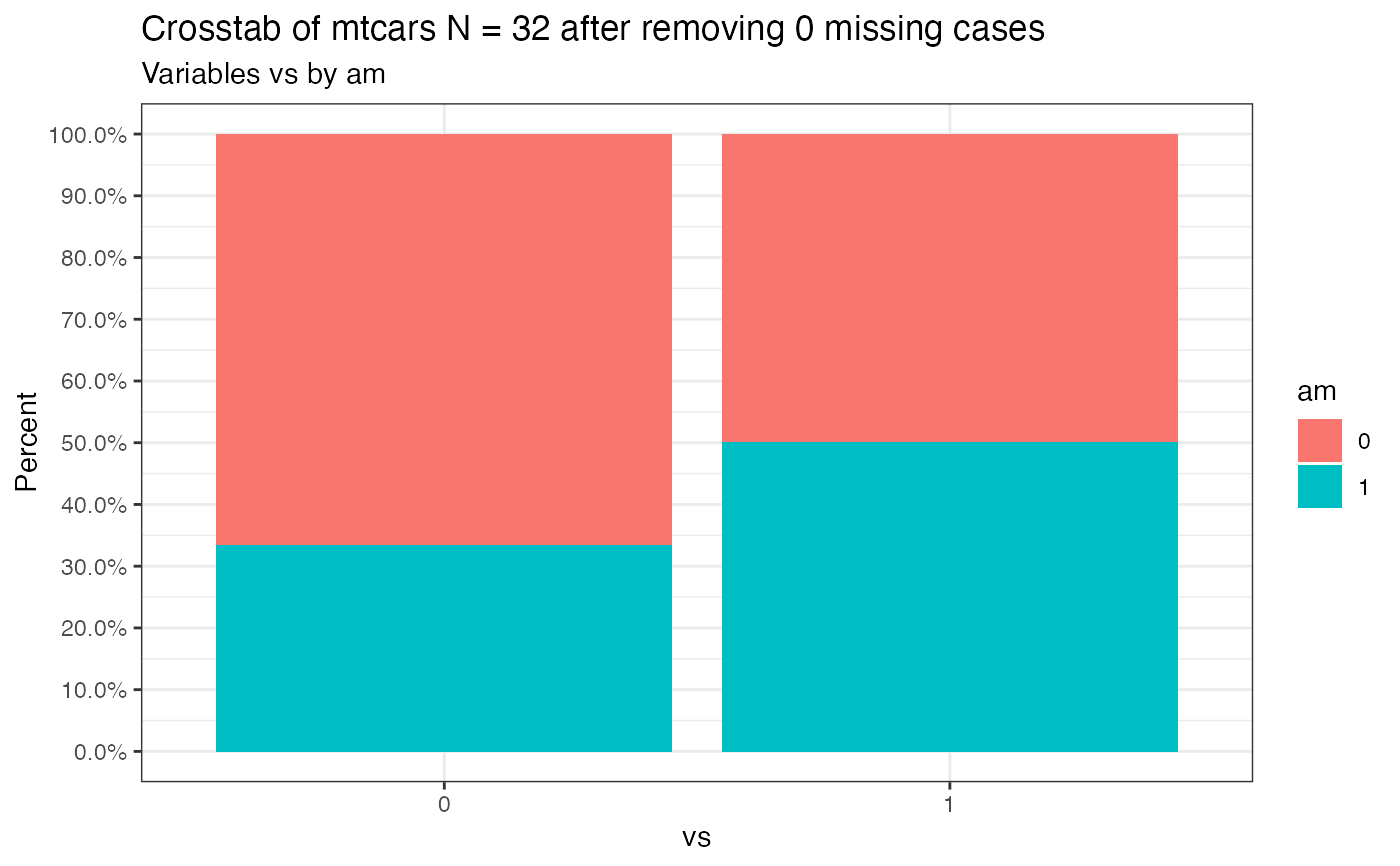
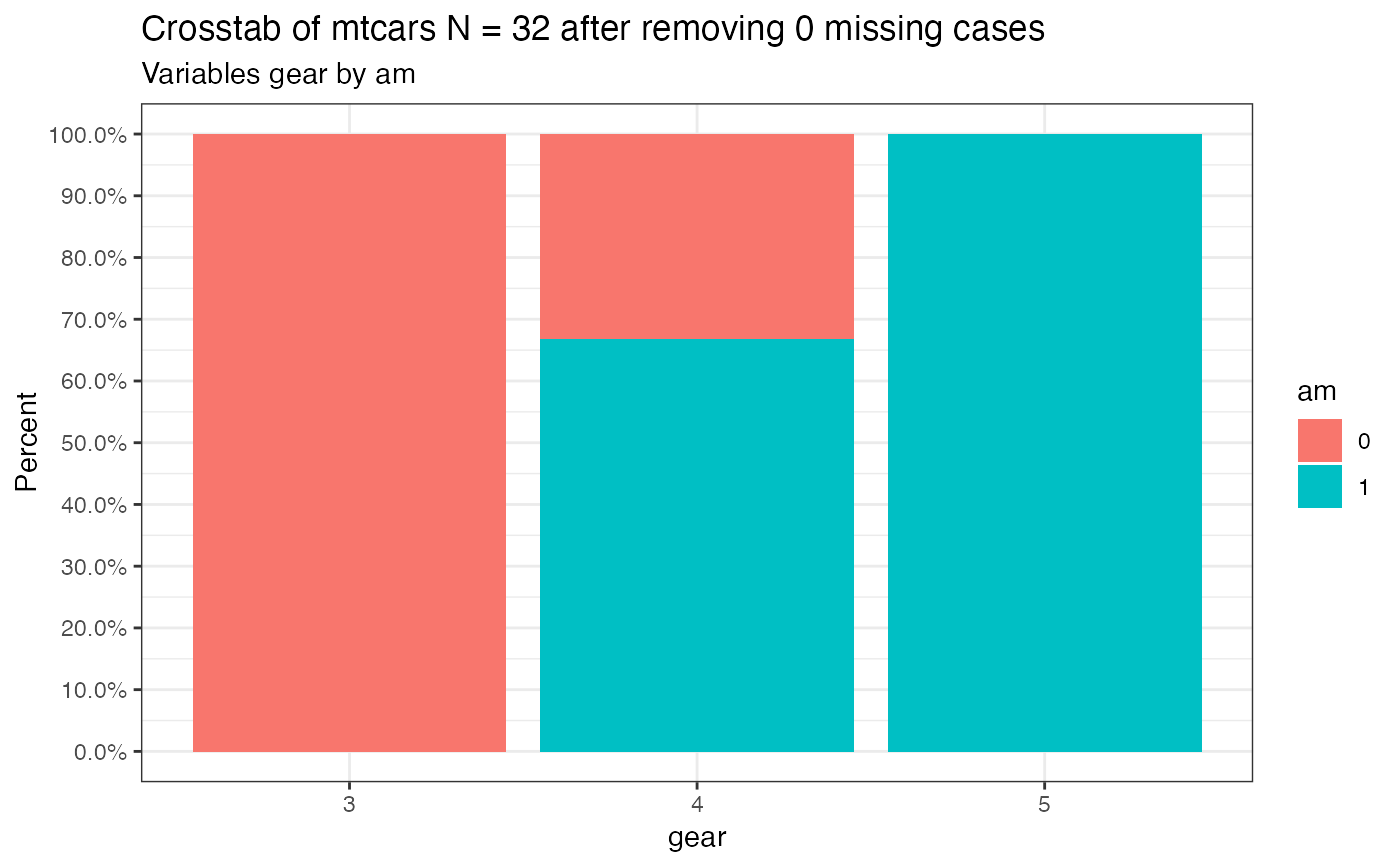
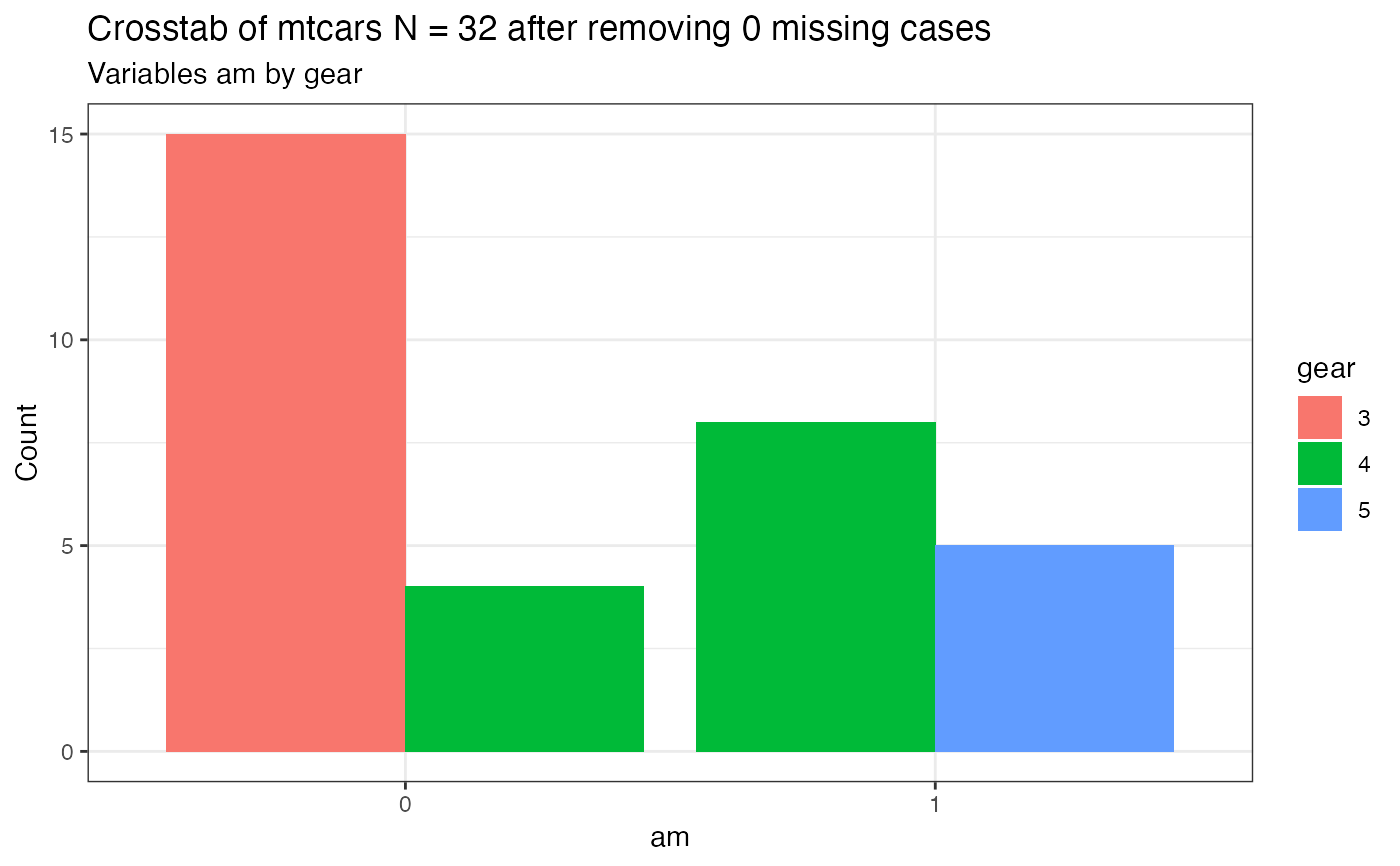
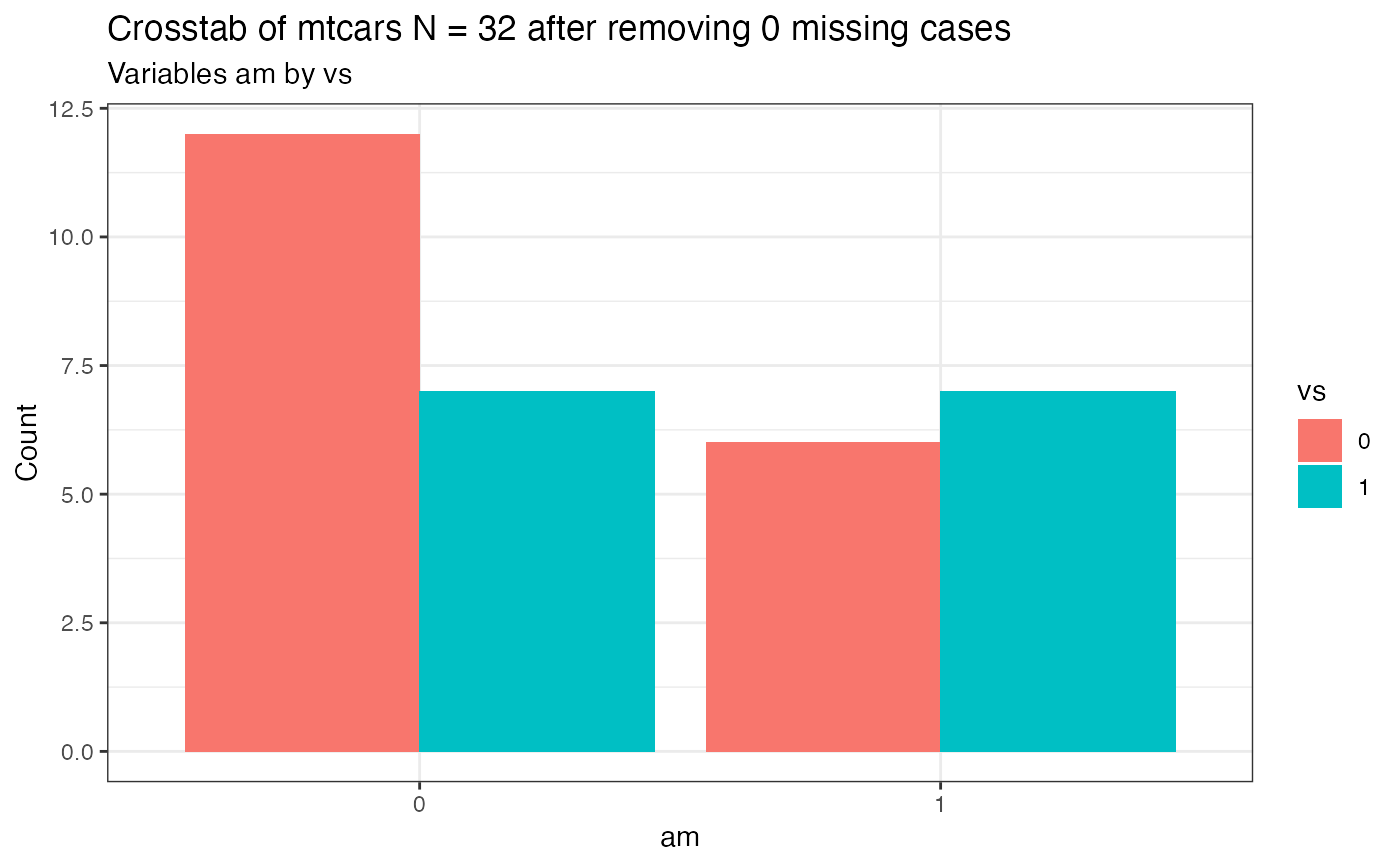
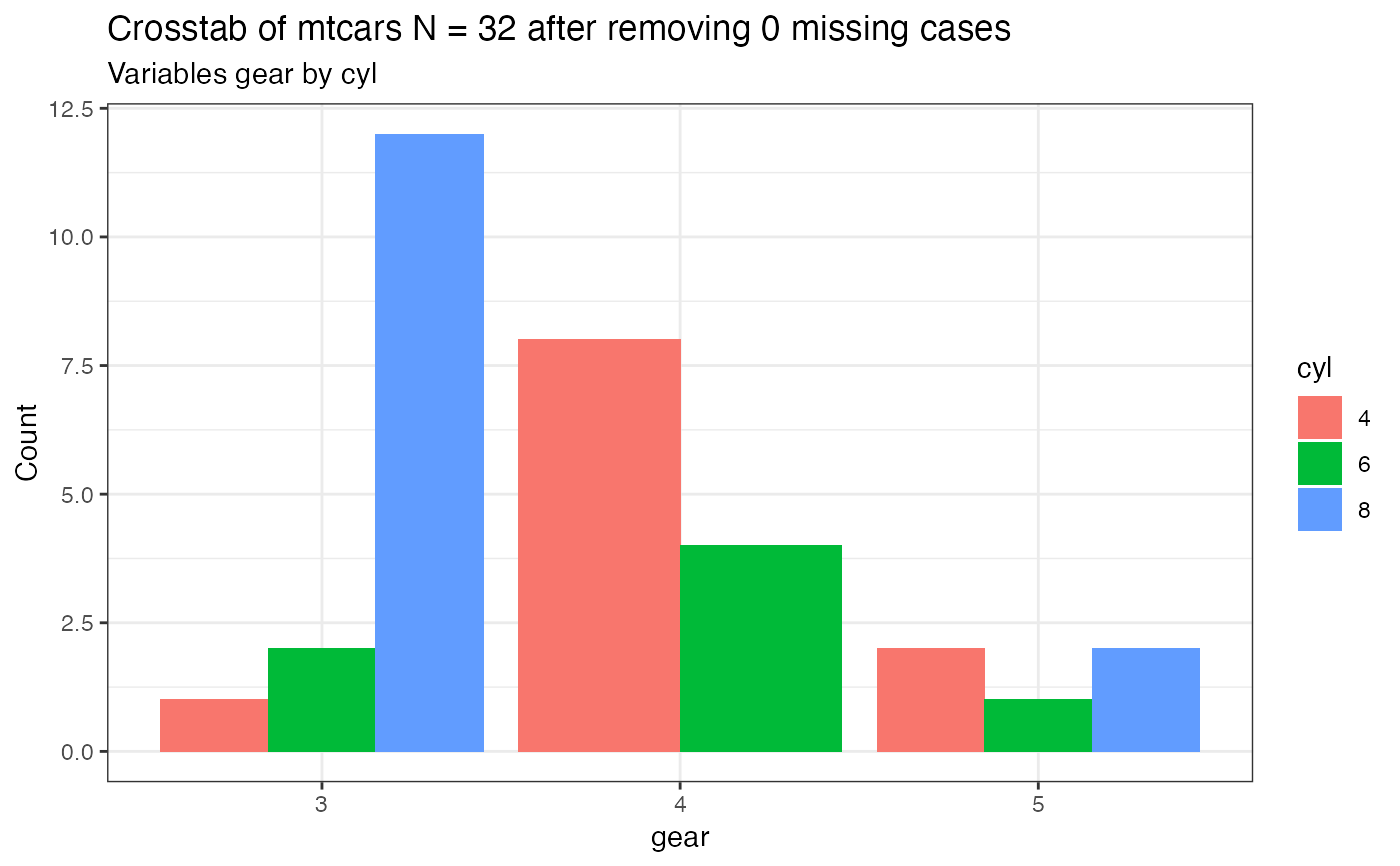
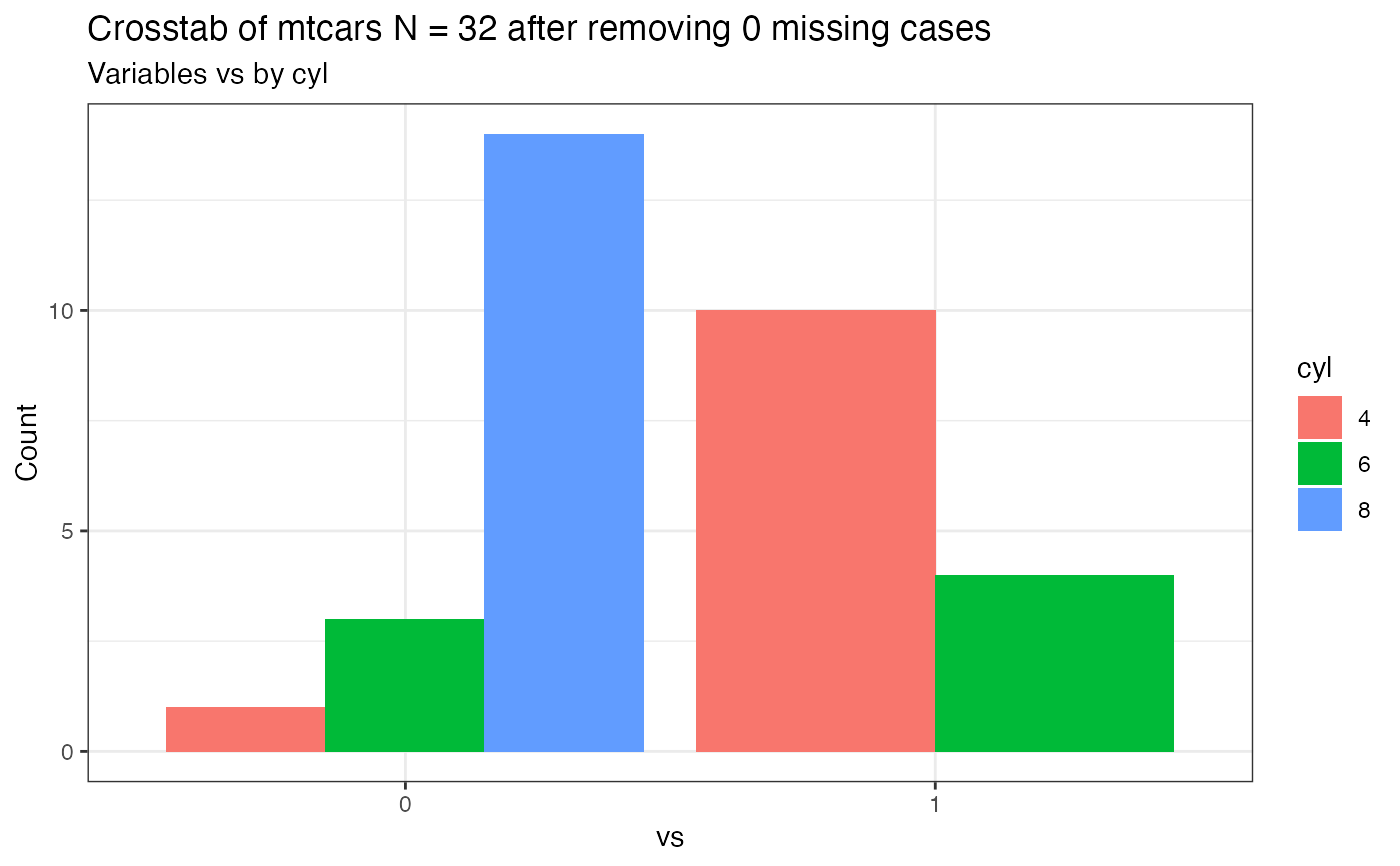
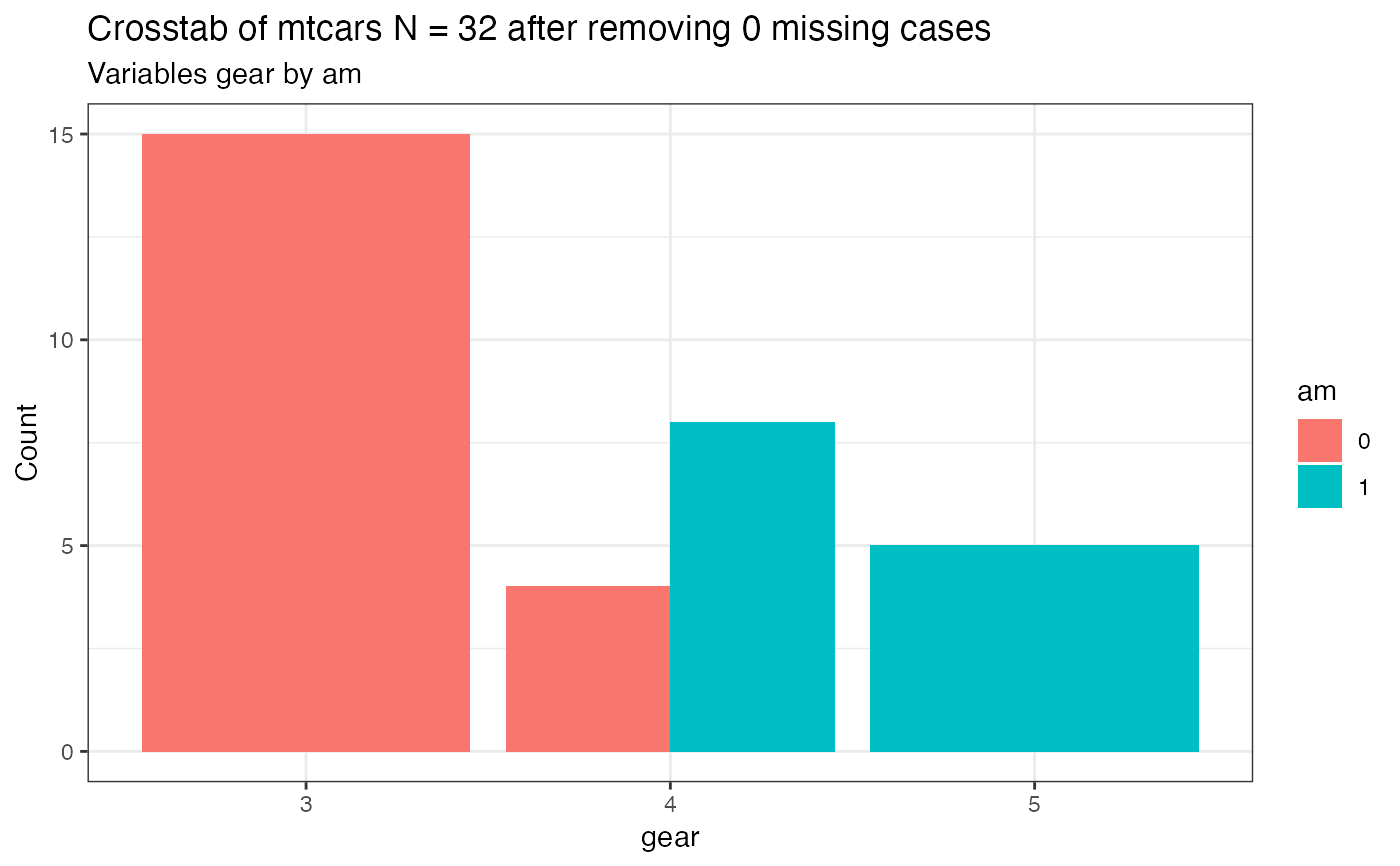
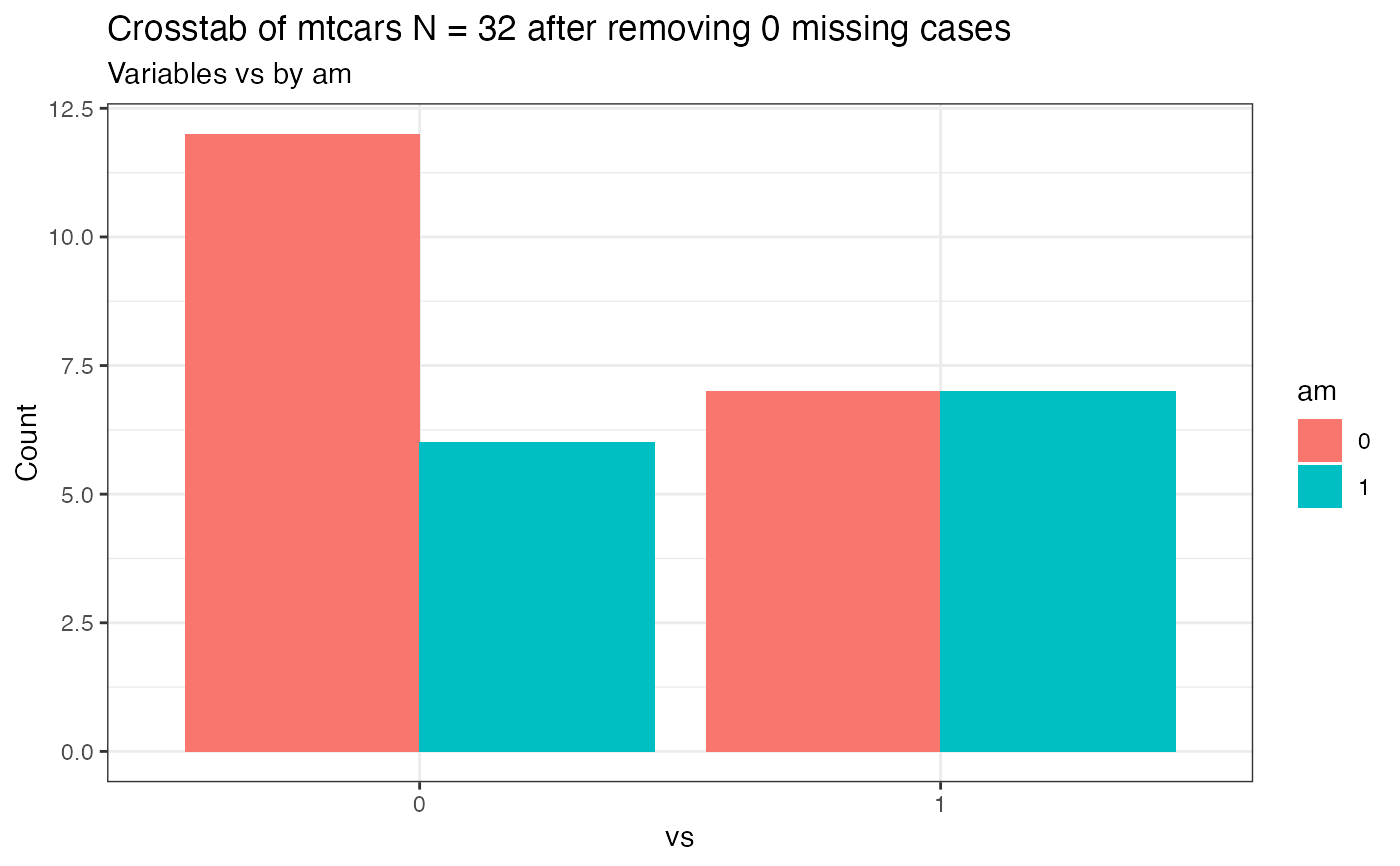
Takes a dataframe and at least two variables as input, conducts a crosstabulation of the variables using dplyr. Removes NAs and then plots the results as one of three types of bar (column) graphs using ggplot2. The function accepts either bare variable names or column numbers as input (see examples for the possibilities)
PlotXTabs(dataframe, xwhich, ywhich, plottype = "side")
Arguments
| dataframe | an object that is of class dataframe |
|---|---|
| xwhich | either a bare variable name that is valid in the dataframe or one or more column numbers. An attempt will be made to coerce the variable to a factor but odd plots will occur if you pass it a variable that is by rights continuous in nature. |
| ywhich | either a bare variable name that is valid in the dataframe or one or more column numbers that exist in the dataframe. An attempt will be made to coerce the variable to a factor but odd plots will occur if you pass it a variable that is by rights continuous in nature. |
| plottype | one of three options "side", "stack" or "percent" |
Value
One or more ggplots to the default graphics device as well as advisory information in the console
See also
Author
Chuck Powell
Examples
PlotXTabs(mtcars, am, vs)#>PlotXTabs(mtcars, am, vs, "stack")#>PlotXTabs(mtcars, am, vs, "percent")#>PlotXTabs(mtcars, am, 8, "side")#>#> Plot #1 am with vs#>PlotXTabs(mtcars, 8, am, "stack")#>#> Plot #1 vs with am#>#>#> Plot #1 am with vs#> Plot #2 am with gear#>#>#> Plot #1 gear with am#> Plot #2 vs with am#>#>#> Plot #1 cyl with gear#> Plot #2 cyl with vs#> Plot #3 am with gear#> Plot #4 am with vs#>if (FALSE) { PlotXTabs(happy, happy, sex) # baseline PlotXTabs(happy, 2, 5, "stack") # same thing using column numbers PlotXTabs(happy, 2, c(5:9), plottype = "percent") # multiple columns RHS PlotXTabs(happy, c(2, 5), 9, plottype = "side") # multiple columns LHS PlotXTabs(happy, c(2, 5), c(6:9), plottype = "percent") PlotXTabs(happy, happy, c(6, 7, 9), plottype = "percent") PlotXTabs(happy, c(6, 7, 9), happy, plottype = "percent") }
